camscortex
Graph Visualization
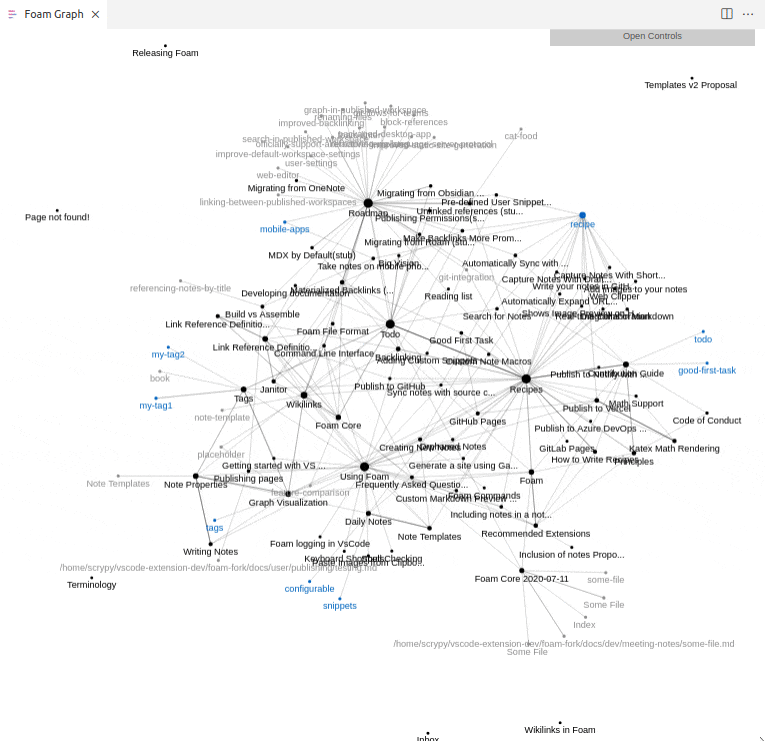
The graph view is one of Foam’s most powerful features. It transforms your collection of notes into a visual network, revealing connections between ideas that might not be obvious when reading individual notes. This guide will teach you how to use the graph view to explore, understand, and expand your knowledge base.
To see the graph execute the Foam: Show Graph command.
Your files, such as notes and documents, are shown as the nodes of the graph along with the tags defined in your notes. The edges of the graph represent either a link between two files or a file that contains a certain tag. A node in the graph will grow in size with the number of connections it has, representing stronger or more defined concepts and topics.
The Show Graph command
- Press
Ctrl+Shift+P/Cmd+Shift+P - Type “Foam: Show Graph”
- Press Enter
You can set up a custom keyboard shortcut:
- Go to File > Preferences > Keyboard Shortcuts
- Search for “Foam: Show Graph”
- Assign your preferred shortcut
Graph Navigation
With the Foam graph visualization you can:
- highlight a node by hovering on it, to quickly see how it’s connected to the rest of your notes
- select one or more (by keeping
shiftpressed while selecting) nodes by clicking on them, to better understand the structure of your notes - navigate to a note by clicking on it’s node while pressing
ctrlorcmd - automatically center the graph on the currently edited note, to immediately see its connections
Filter View
If you only wish to view certain types of notes or tags, or want to hide linked attachment nodes then you can apply filters to the graph.
- Open the graph view using the
Foam: Show Graphcommand - Click the button in the top right corner of the graph view that says “Open Controls”
- Expand the “Filter By Type” dropdown to view the selection of types that you can filter by
- Uncheck the checkbox for any type you want to hide
- The types displayed in this dropdown are defined by [note-properties] which includes Foam-standard types as well as custom types defined by you!
Custom Graph Styles
The Foam graph will use the current VS Code theme by default, but it’s possible to customize it with the foam.graph.style setting.
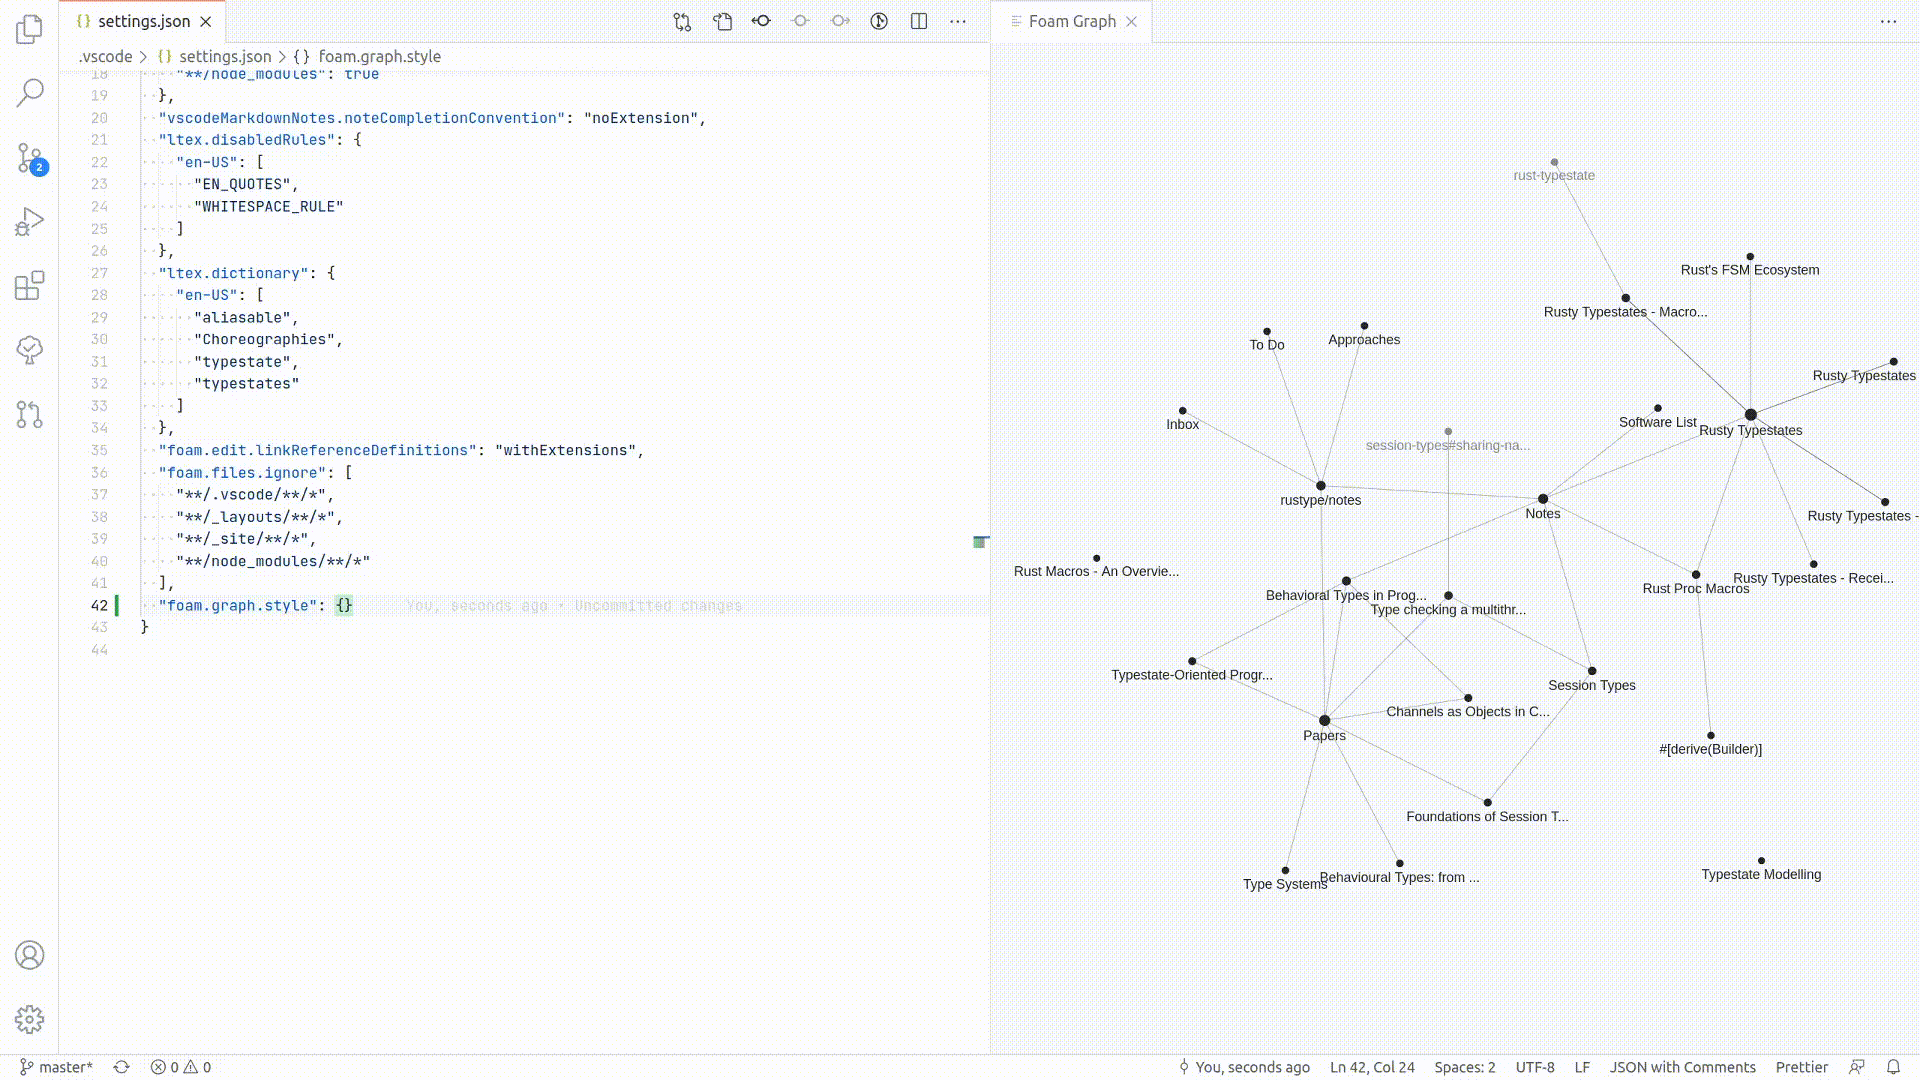
A sample configuration object is provided below, you can provide as many or as little configuration as you wish:
"foam.graph.style": {
    "background": "#202020",
    "fontSize": 12,
    "fontFamily": "Sans-Serif",
    "lineColor": "#277da1",
    "lineWidth": 0.2,
    "particleWidth": 1.0,
    "highlightedForeground": "#f9c74f",
    "node": {
        "note": "#277da1",
    }
}
backgroundbackground color of the graph, adjust to increase contrastfontSizesize of the title font for each nodefontFamilyfont of the title font for each nodelineColorcolor of the edges between nodes in the graphlineWidththickness of the edges between nodesparticleWidthsize of the particle animation showing link direction when highlighting a nodehighlightedForegroundcolor of highlighted nodes and edges when hovering over a node- to style individual types of nodes jump to the next section: Style Nodes By Type
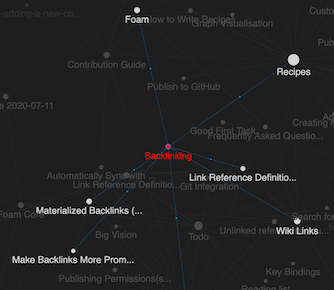
Style Nodes by Type
It is possible to customize the style of a node based on the type property in the YAML frontmatter of the corresponding document.
There are a few default node types defined by Foam that are displayed in the graph:
notedefines the color for regular nodes whose documents have not overridden thetypeproperty.placeholderdefines the color for links that don’t match any existing note. This is a [[placeholder]] because no file with such name exists.- see [wikilinks] for more info
tagdefines the color for nodes representing #tags, allowing tags to be used as graph nodes similar to backlinks.- see [tags] for more info
featureshows an example of how you can use note types to customize the graph. It defines the color for the notes of typefeature- see [note-properties] for details
For example the following backlinking.md note:
---
type: feature
---
# Backlinking

...
And the following settings.json:
"foam.graph.style": {
    "background": "#202020",
    "node": {
        "note": "#277da1",
        "placeholder": "#545454",
        "tag": "#f9c74f",
        "feature": "red",
    }
}
Will result in the following graph:
What’s Next?
With graph view mastery, you’re ready to explore advanced Foam features:
- [wikilinks] - Understand bidirectional connections
- [templates] - Use templates effectively to standardize your note creation
- [tags] - Organize your notes with tags
- [daily-notes] - Set up daily notes to establish capture routines